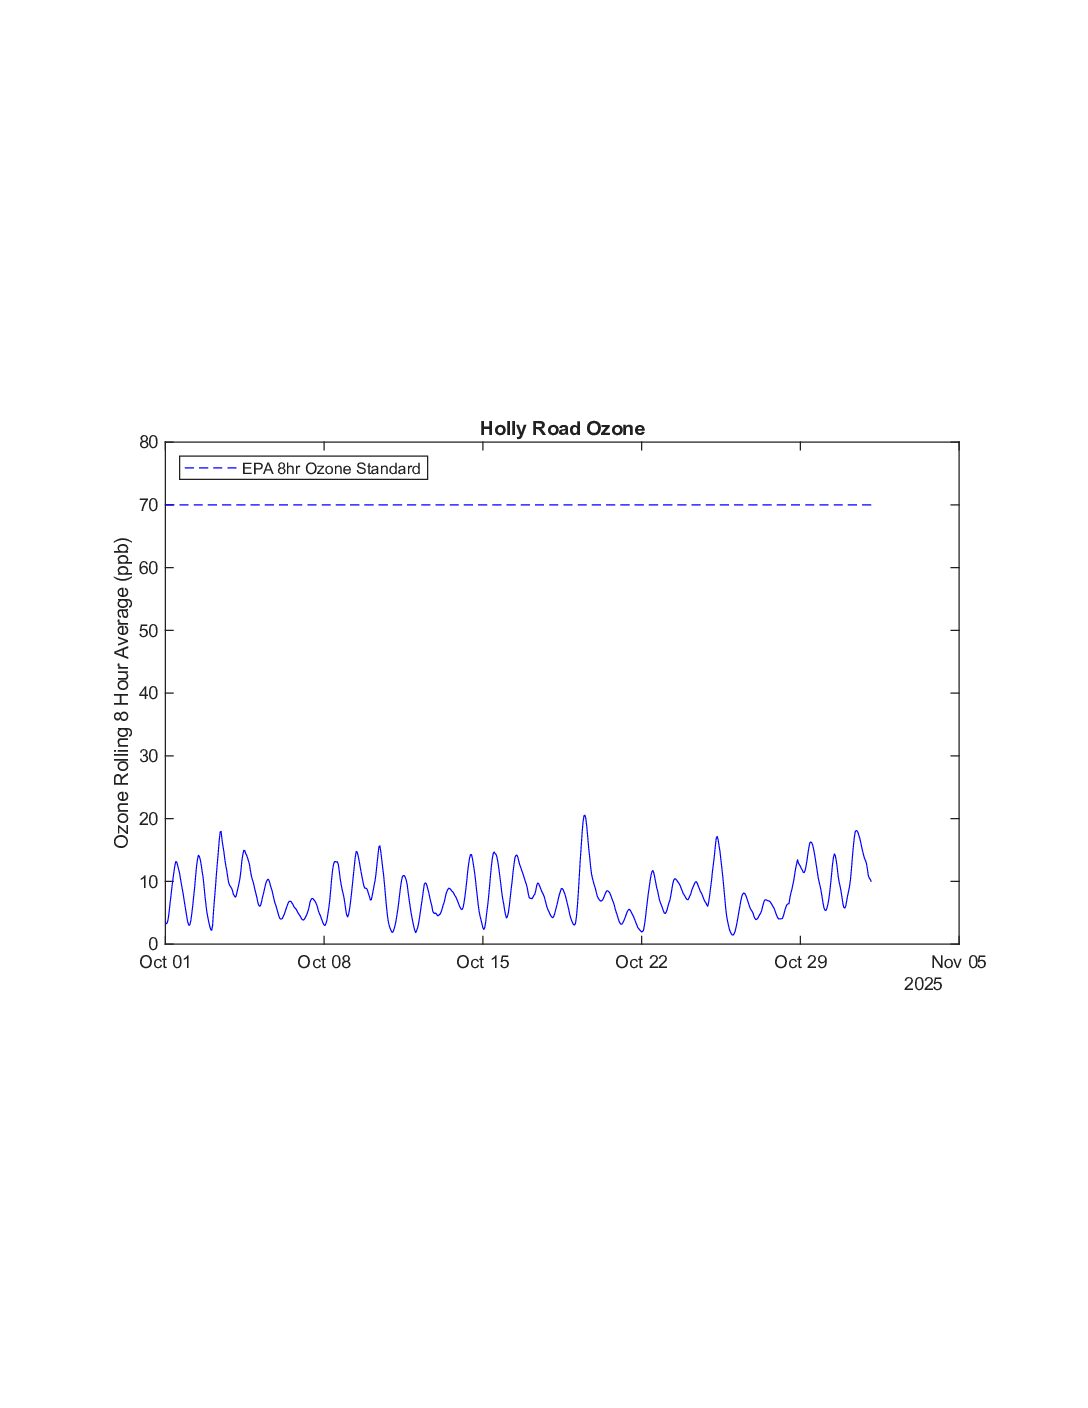
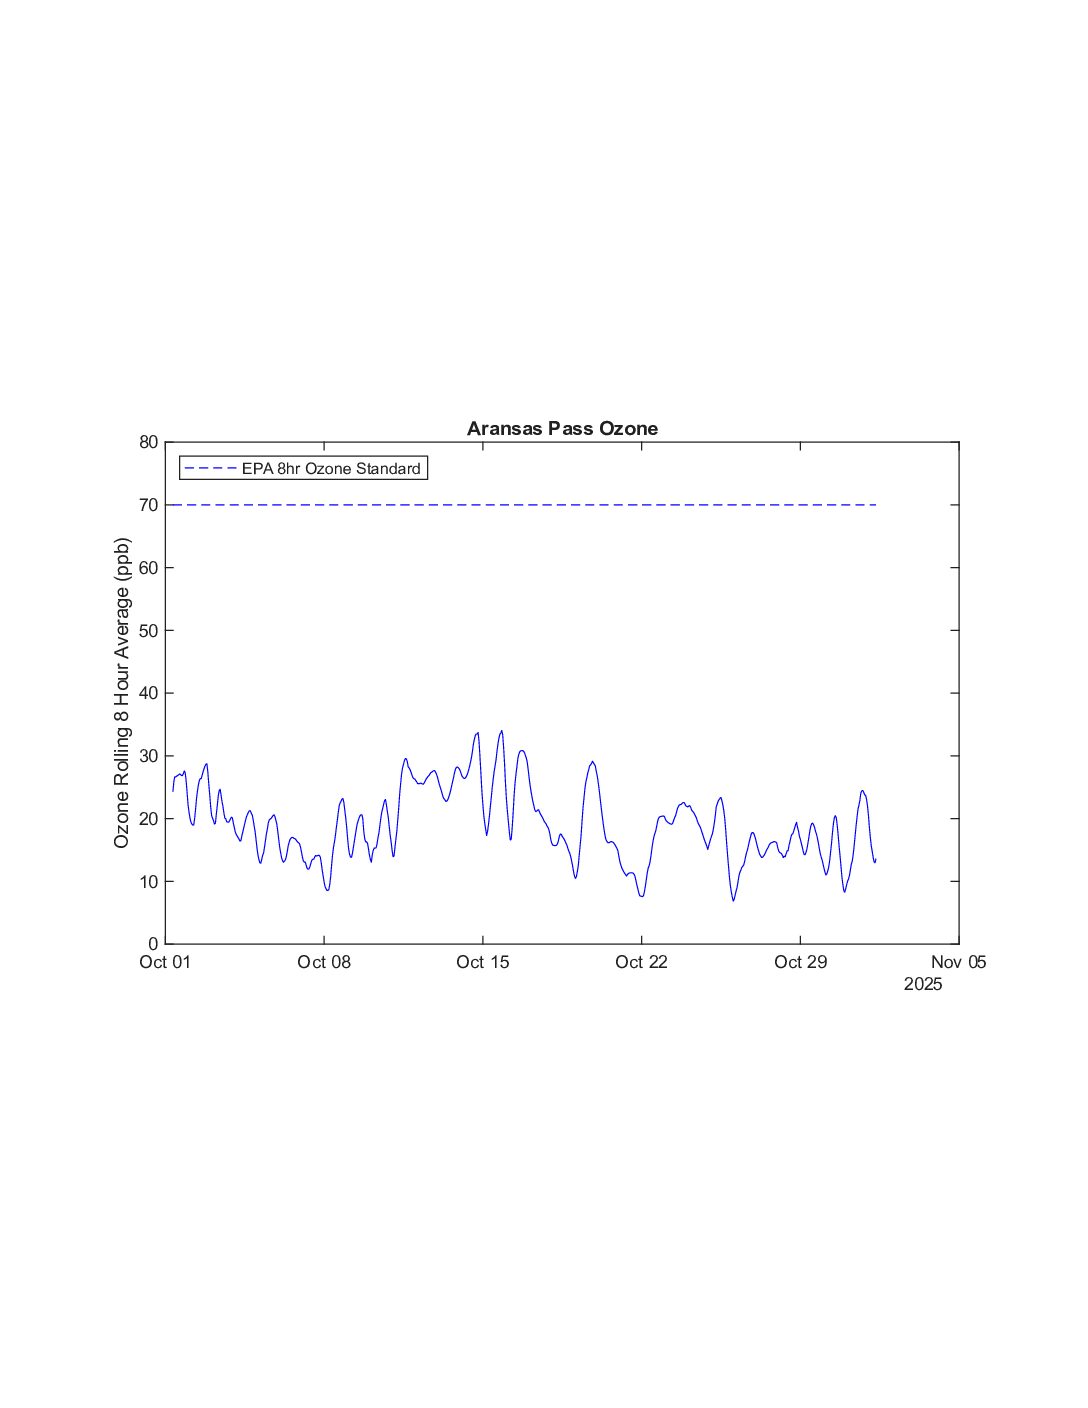
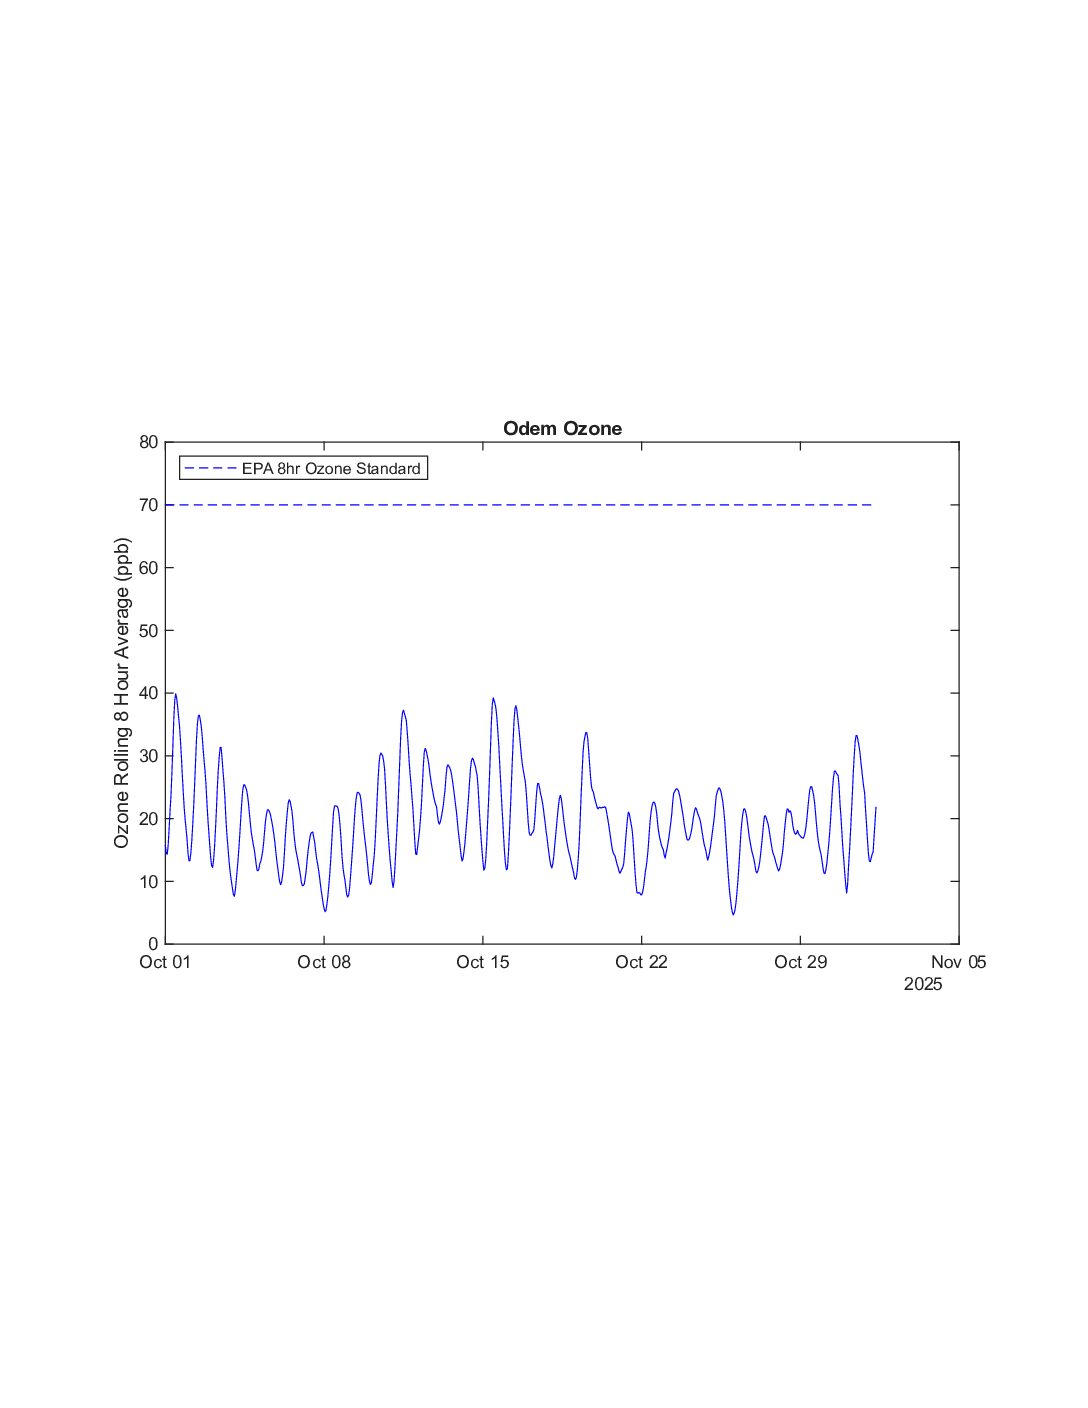
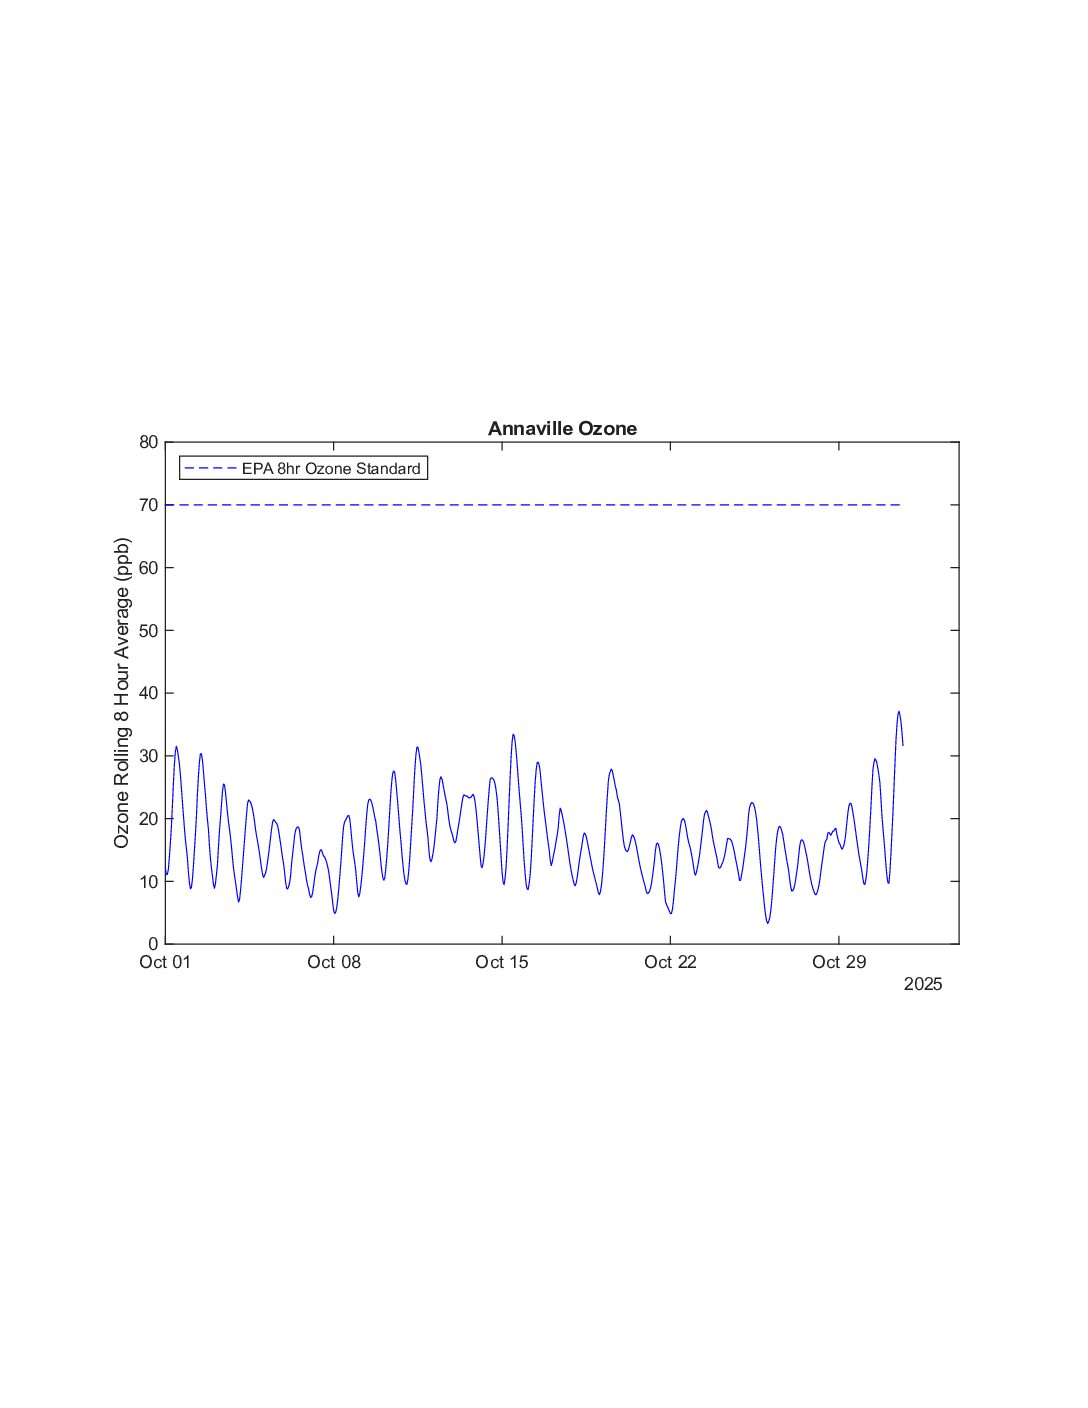
Ozone (O3) – is a gas diluted in the air, and its concentrations are expressed as the ratio of molecules of O3 to total molecules in the air, and, because concentrations are so low, concentrations are expressed as parts of O3 per billion parts of air, abbreviated “ppb”. When inhaled, ozone can damage the lungs. Relatively low amounts can cause chest pain, coughing, shortness of breath and throat irritation. Ozone may also worsen chronic respiratory diseases such as asthma and compromise the ability of the body to fight respiratory infections. People vary widely in their susceptibility to ozone. The current National Ambient Air Quality Standard (NAAQS) set by the EPA is 70 ppb and determined as the annual fourth-highest daily maximum 8-hour concentration, averaged over 3 years. A good resource for general information about ozone is the EPA website: https://www.epa.gov/ground-level-ozone-pollution
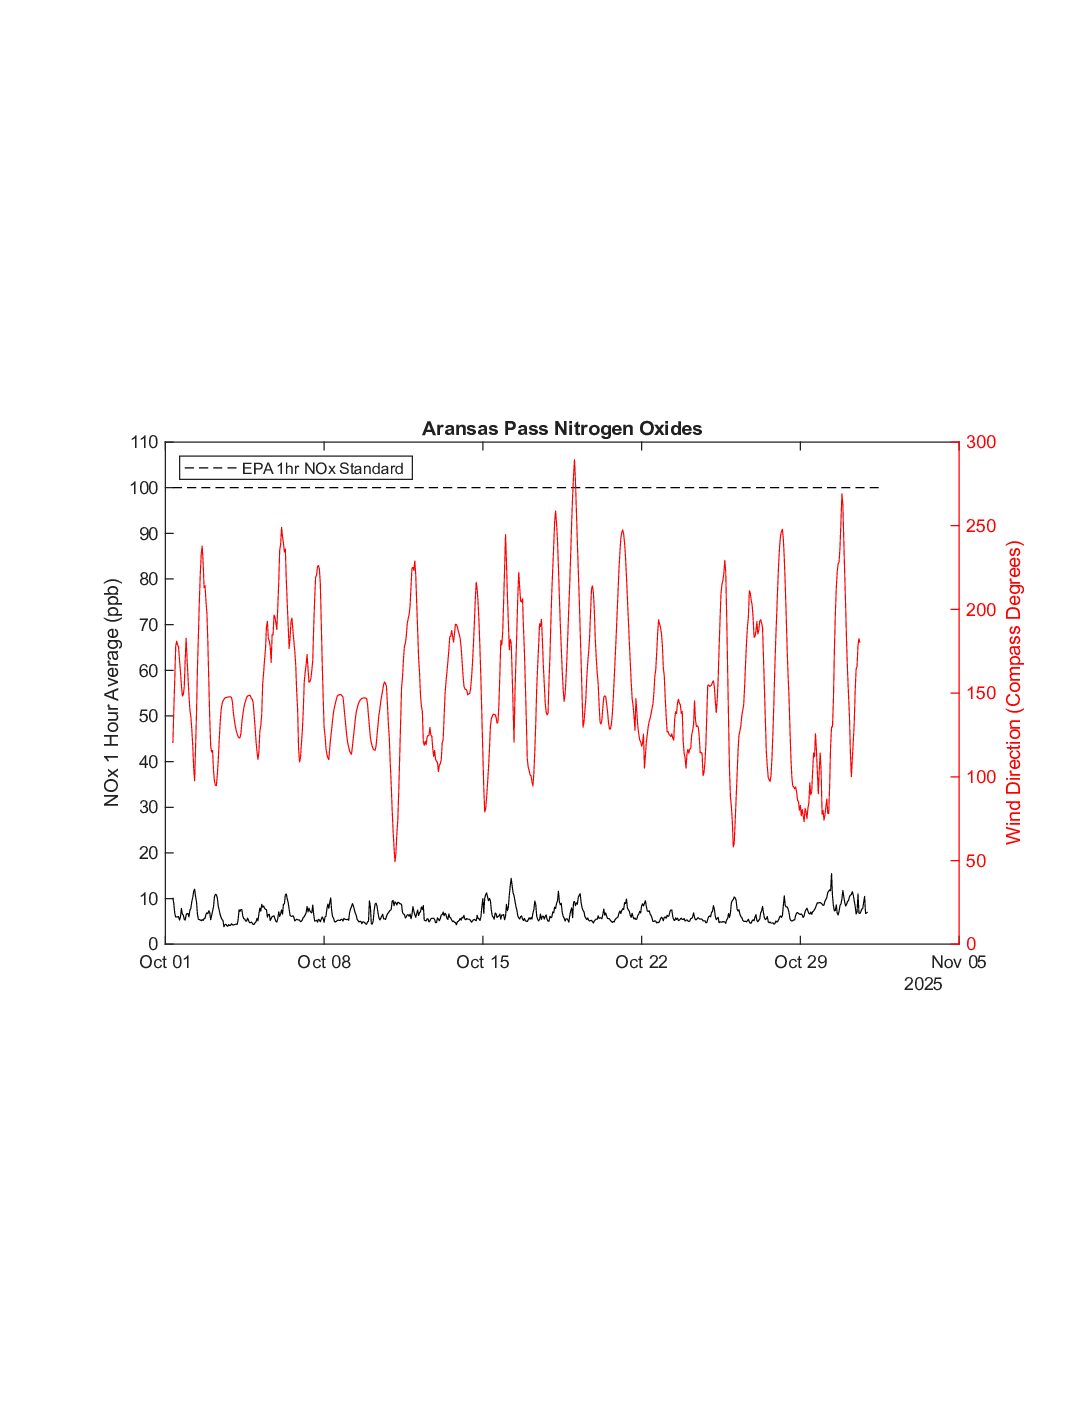
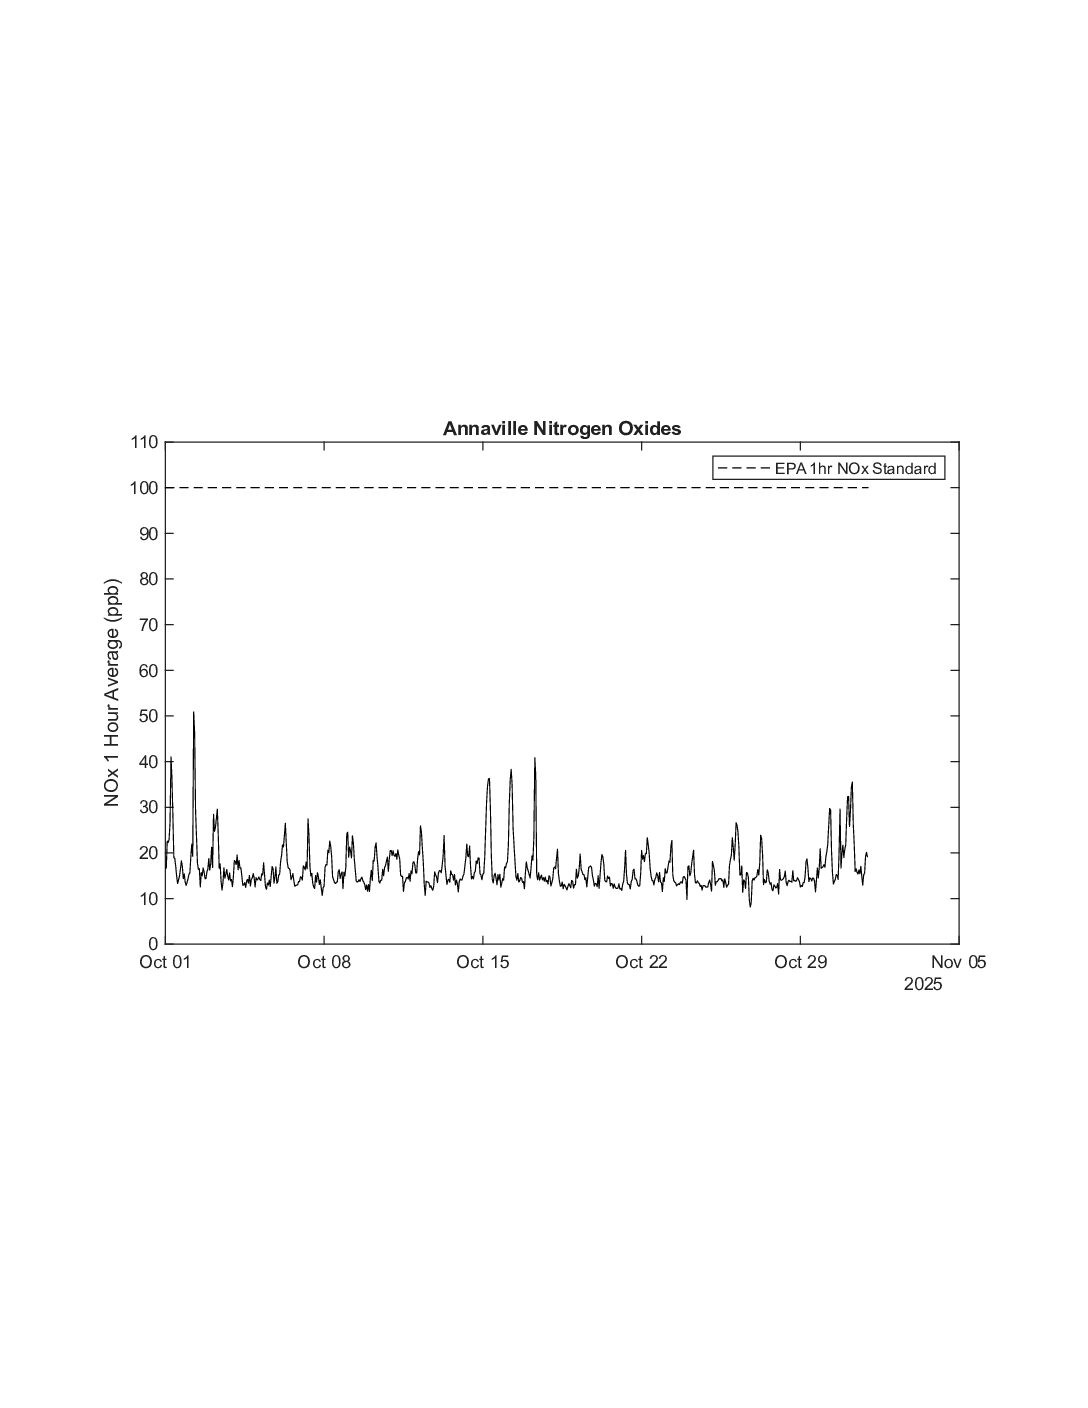
NOx (NO + NO2) – nitrogen oxides are gaseous atmospheric pollutants, mainly generated by anthropogenic human activities. NO2 is regulated as it is the predominant form of NOx and reacts in the atmosphere to create ozone (O3). The current NAAQS set by the EPA is 100 ppb and is determined as the 98th percentile of 1-hour daily maximum concentration, averaged over 3 years. For more information visit the EPA website: https://www.epa.gov/no2-pollution
As NOx reacts to form ozone, monitoring its concentration is a useful tool for diagnosing changes in ozone concentration. One major factor to this is wind direction. In our airshed, the predominant wind direction is S/SE, with wind coming from the Gulf of Mexico or Mexico. During times when this predominant wind direction shifts to N, like during a cold front, our airmass is now coming from inland, often from the Houston or San Antonio regions. This airmass carries pollutants from its source, often having higher average NOx concentrations than typically observed in the Corpus Christi region. This influx of NOx often causes an increase in O3.
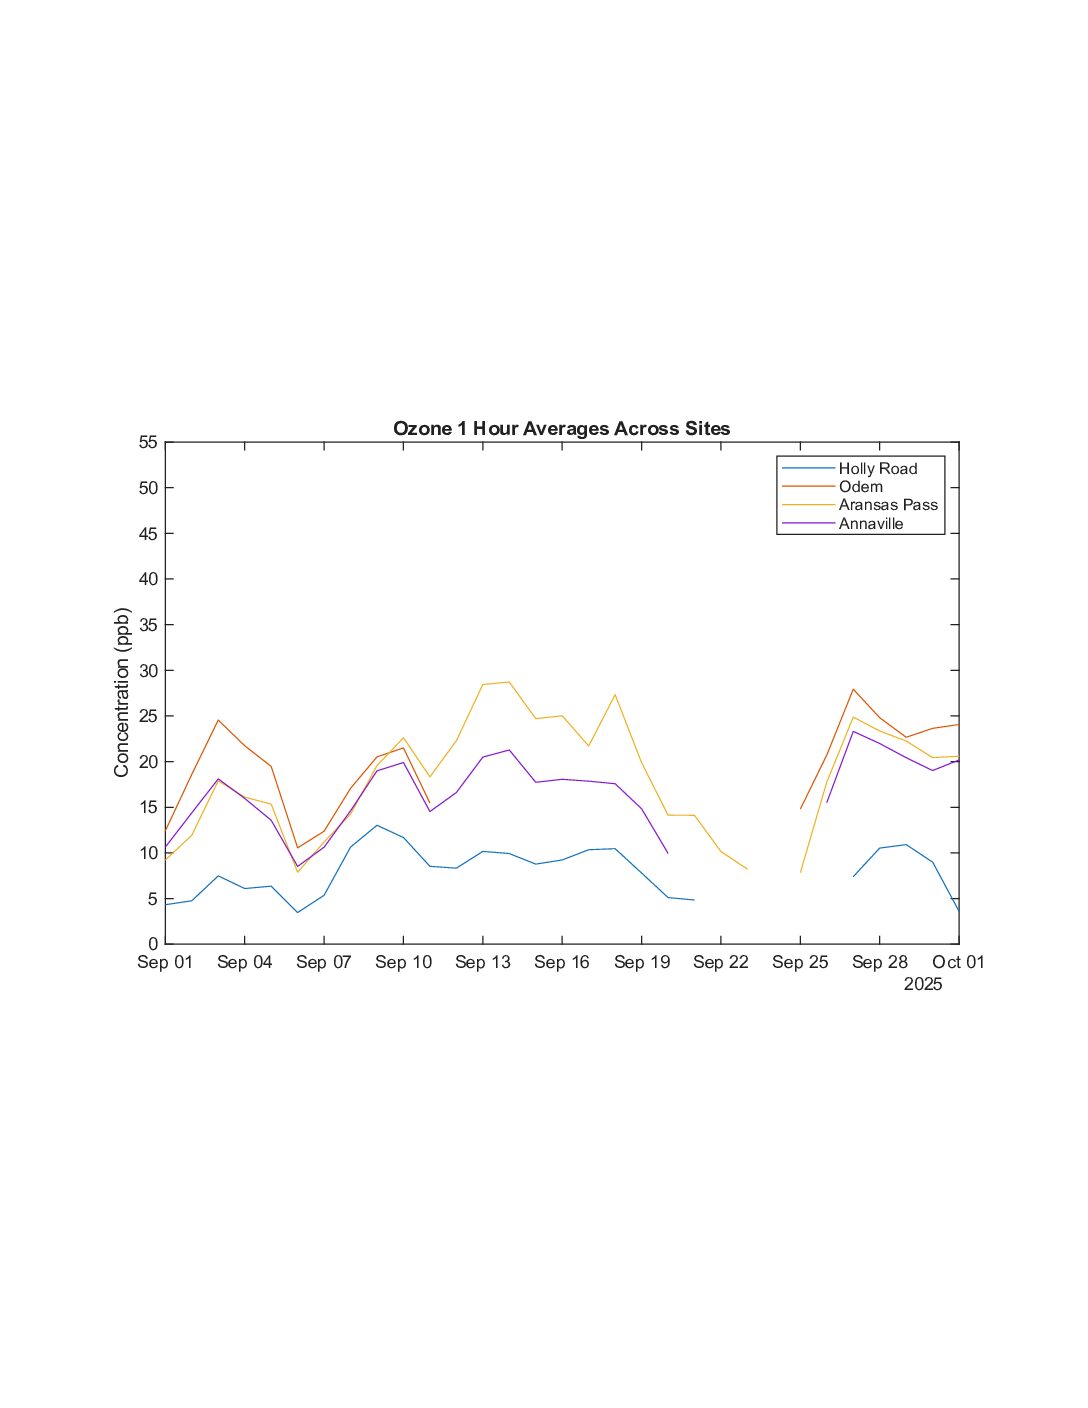
We are currently monitoring ozone, nitrogen oxides, and wind direction at four air monitoring stations in Nueces and San Patricio Counties using Federal Equivalent Method ozone analyzers (site location figure below). Each month, we will post 8-hour running averages of ozone concentrations and 1-hour averages of NOx concentrations from each site. The data is presented in figures below along with a dashed line to represent the NAAQS standard. The annual fourth-highest daily maximum 8-hour ozone concentration, averaged over 3 years must remain below the NAAQS (70 ppb) in order for the region to stay within ozone attainment.
Particulate Matter (PM) – is a mixture of solid particles and liquid droplets suspended in the air. It is characterized not by what it is composed of, but rather by the size of the particles. It is characterized in PM10 and PM2.5. Both these categories describe inhalable particles, which can be detrimental to the cardiovascular system, which is why these pollutants are part of the EPA’s Criteria Air Pollutants. The EPA’s National Ambient Air Quality Standards (NAAQS) for particulates were revisited on February 2024, changing the annual PM2.5 standard to 9 ug/m3
AirNow is a website that showcases the Air Quality Index, and events like fires, smoke, and dust that increase particulate matter.
The Saharan Air Layer is a mass of very dry, dusty air that forms over the Sahara Desert during the late spring, summer, and early fall, and moves over the tropical North Atlantic Ocean every three to five days. It has the potential to effect air quality, weather, and climate. For more information, click here.
To view Corpus Christi’s current 1-hour ozone levels on the TCEQ website, click here.
News: Be aware of wildfires!
You can check out the AirNow website for updates on wildfire emissions throughout the coastal bend. You can check out smoke movement and wildfire maps.